Analytics Reports in JsRates
JsRates provides comprehensive analytics to monitor the performance of your shipping rules and AI usage, accessible through the Analytics page.
Available Reports
You can explore various reports with visual representations like bar graphs and progress bars, which can be filtered by different time ranges: Today, Yesterday, Last 7 days, Last 30 days, Week to date, and Month to date.
Export options are available in multiple formats, including image files (JPG, PNG, SVG), PDF, and CSV.
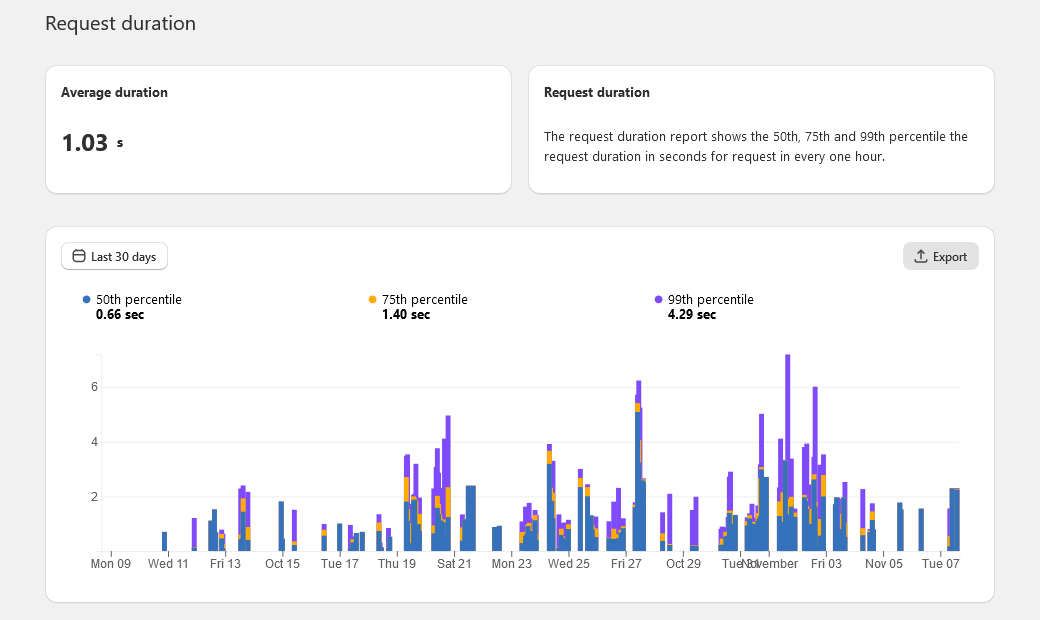
Request Duration
Track how long it takes for requests to be processed:
- Percentiles (50th, 75th, 99th) of request durations are shown hourly.
- Includes all requests from the editor, API, or checkout page.
- Average request duration in seconds
Request Status
Gain insights into the success and error rates of processed requests:
- Counts and status of hourly requests.
- Source-specific data: editor, API, and checkout.
- Percentages for successful processes and errors.
Shipping Rates
Understand the shipping rates offered to your customers:
- Percentiles (50th, 75th, 99th) of the minimum shipping rate per request hourly.
- Differentiates between multiple currencies if applicable.
Request Duration Distribution
Visualize the spread of request processing times:
- Histogram of request durations in 0.5-second intervals.
- Highlights requests exceeding Shopify's 10-second response limit.
- Median request duration for selected time frames.
AI Characters Usage
Monitor your AI characters quota:
- Progress bar indicating AI characters used and remaining for the month.
- Differentiates between full plan and demo subscribers.
Request Usage (Demo Subscribers)
Specific to demo subscribers:
- Displays the number of request quota used and the remaining trial quota.
These reports are designed to help you optimize your shipping rules, ensure timely responses, and effectively manage your AI character usage.