Code Debugging Features
JsRates is equipped with robust debugging tools to enhance your coding experience.
-
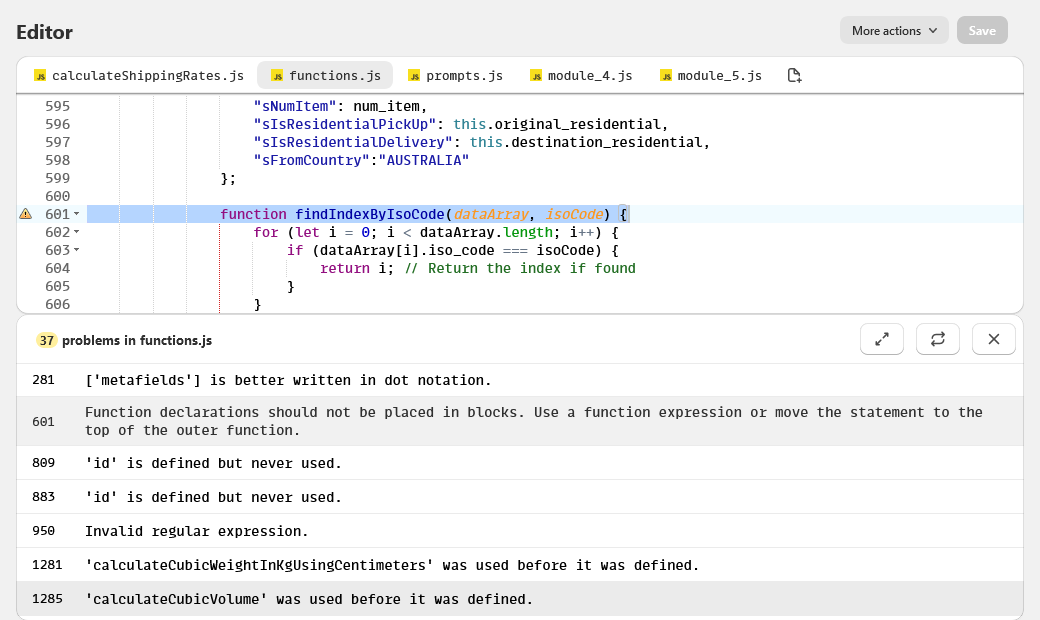
Syntax Feedback: Our code editor includes syntax highlighting to help you identify errors as you type.
-
Linting Report: Access a detailed report of syntax issues by selecting problems from the More Actions menu. This report appears at the bottom of the Editor page, displaying problems with their line numbers and descriptions. Clicking on an error in the list will bring the problematic line into focus within the editor.
-
Save-Time Debugging: JsRates performs a check each time you save your code. If it finds errors, such as invalid module imports, it will display a description of the issue in the output window.
-
Runtime Error Reports: JsRates provides a report for any runtime errors to assist in effective troubleshooting. When executing code from the Editor page, these errors are shown in the output window. Additionally, runtime errors that occur during code executions triggered from the Editor page, through the JsRates API, or from the checkout page, are saved in the output logs for subsequent access and analysis.